Vegetation Erosion Prediction
# Predicting Heightfield Data using cGANs
The basic functionalities were already demonstrated by SideFX in a talk they gave about PDG.
# Concept
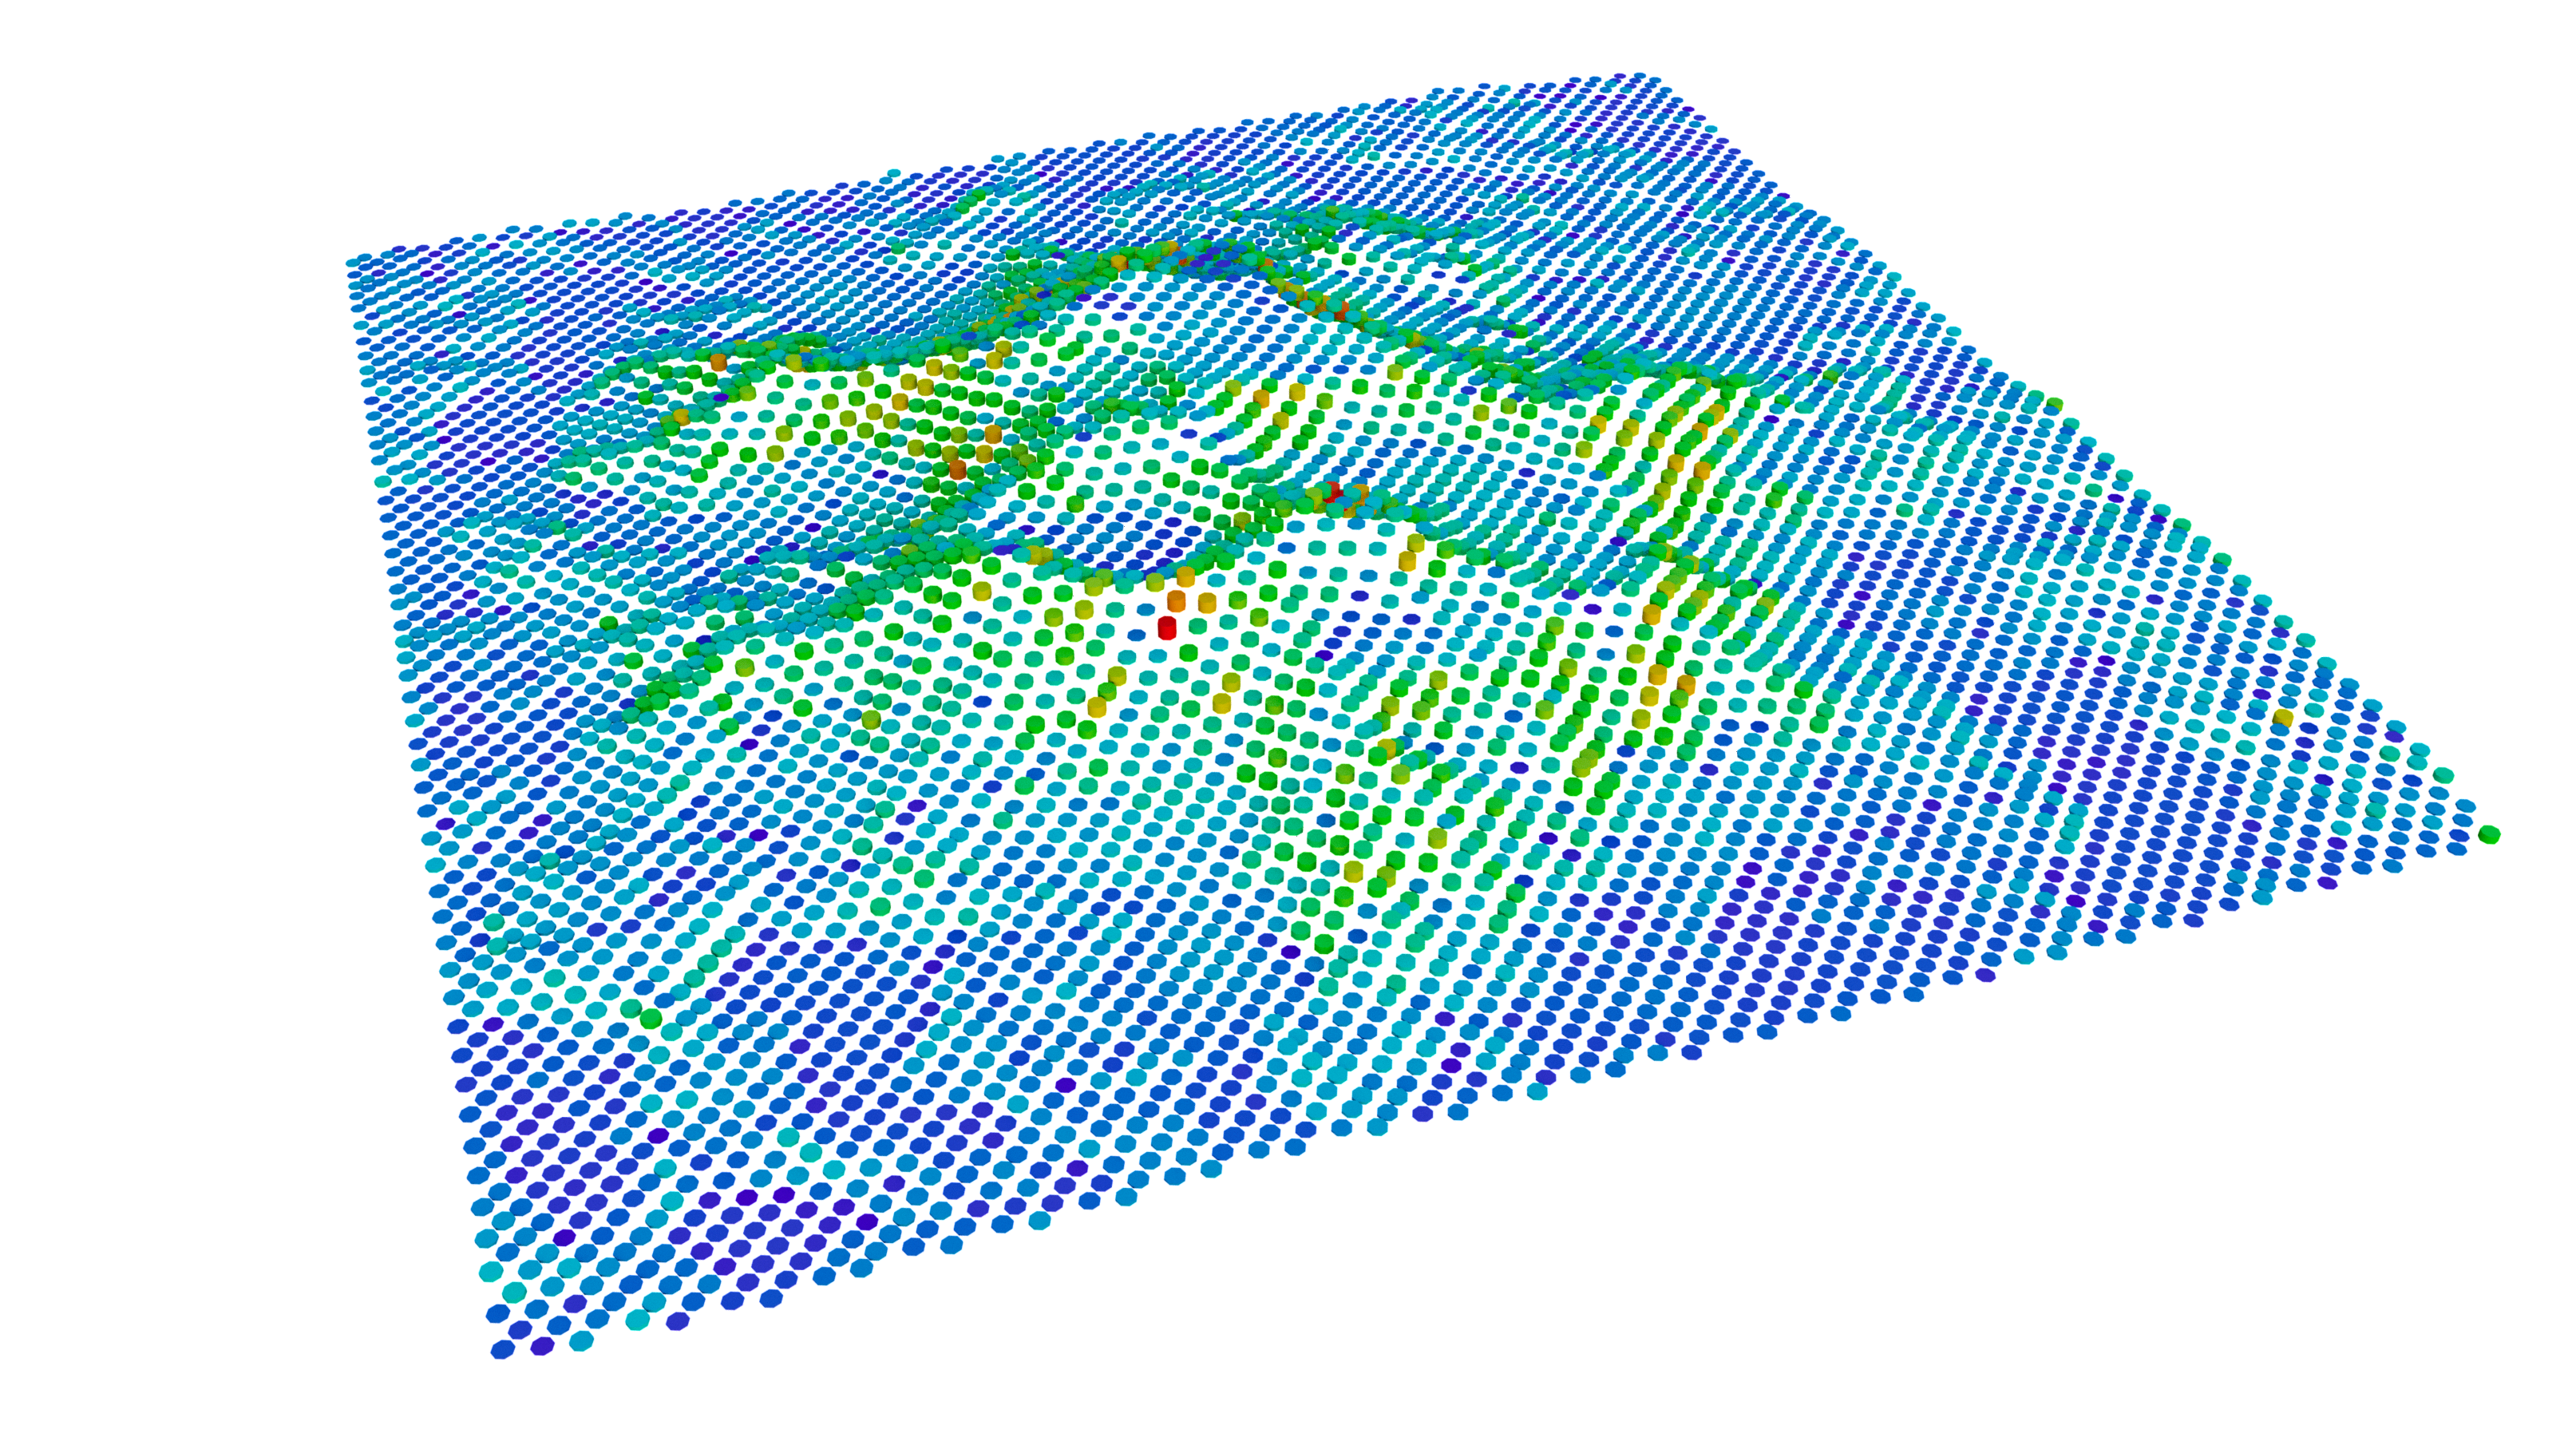
Heightfields are essentially images (2D volumes). Their grid-like topology makes them perfect for machine learning.
![]()
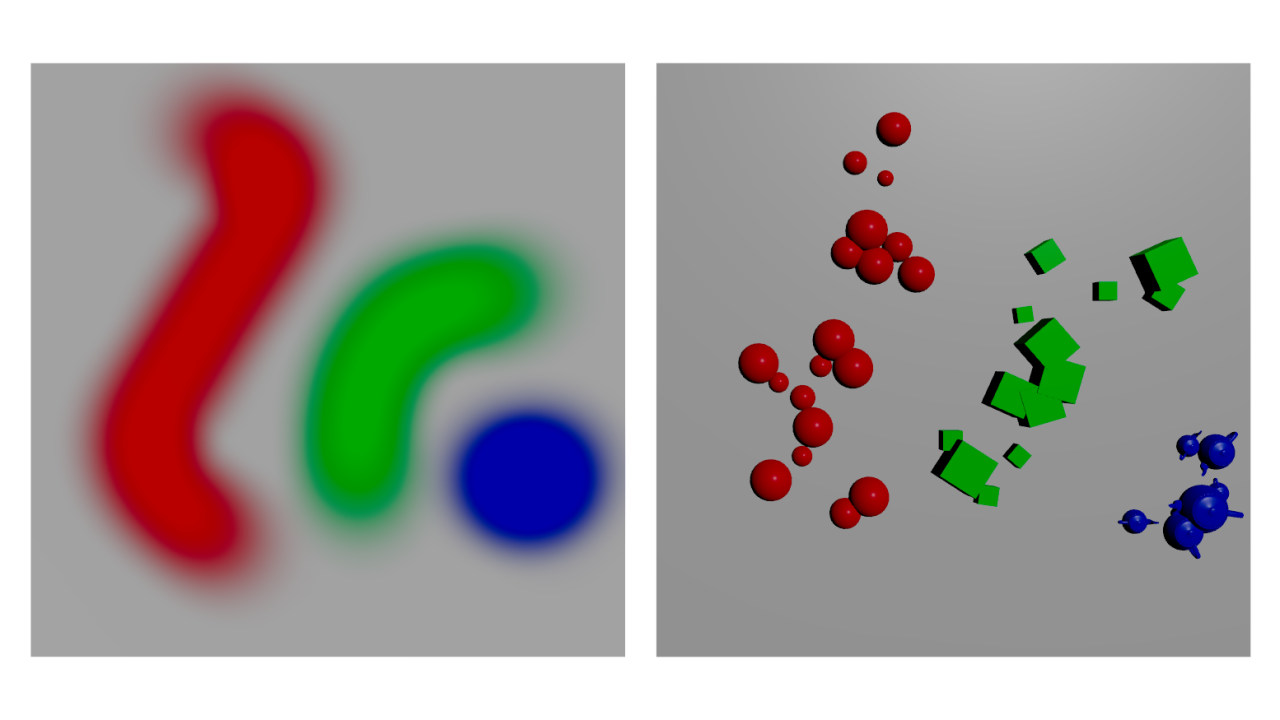
Similar to height data all sorts of other information can be stored in masks on the heightfield. The image below shows masks, which can be used to scatter geometry later.
The idea is to train a ML model to predict masks, and erosion based on the input heightmap.
# Pix2Pix
Pix2Pix is a popular machine learning model which translates images from one state to another. Similar to language translation you can translate the content of an image to a different art style.
To train pix2pix you need lots of image pairs that show the input and the result you want to get.
# Setup
The setup is as shown below:
- build a procedural environment setup (Output heightfield and masks etc.)
- use PDG to randomize some parameters to generate a sufficiently large dataset
- calculate erosion output / vegetation masks for each randomized Input
- fetch results in PDG and combine to image pairs
- train pix2pix model on image pairs
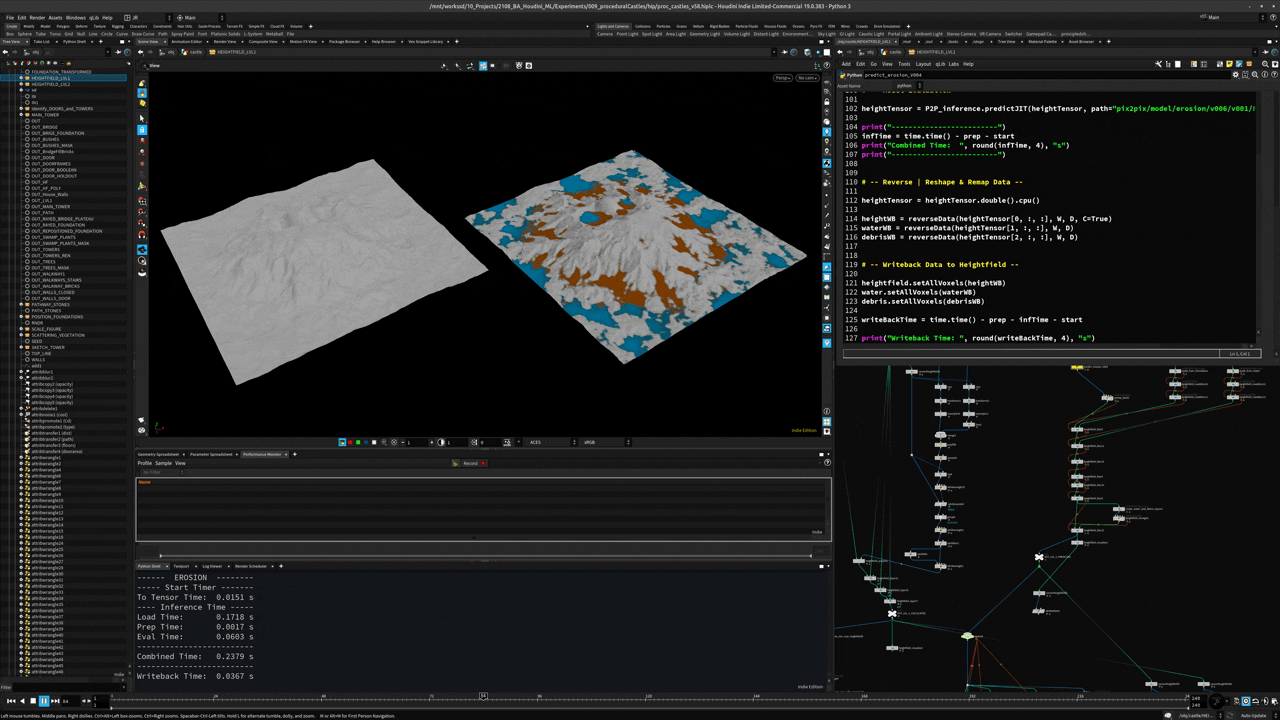
- feed new inputs to the model and let it predict the results using a python sop that calls the pytorch model
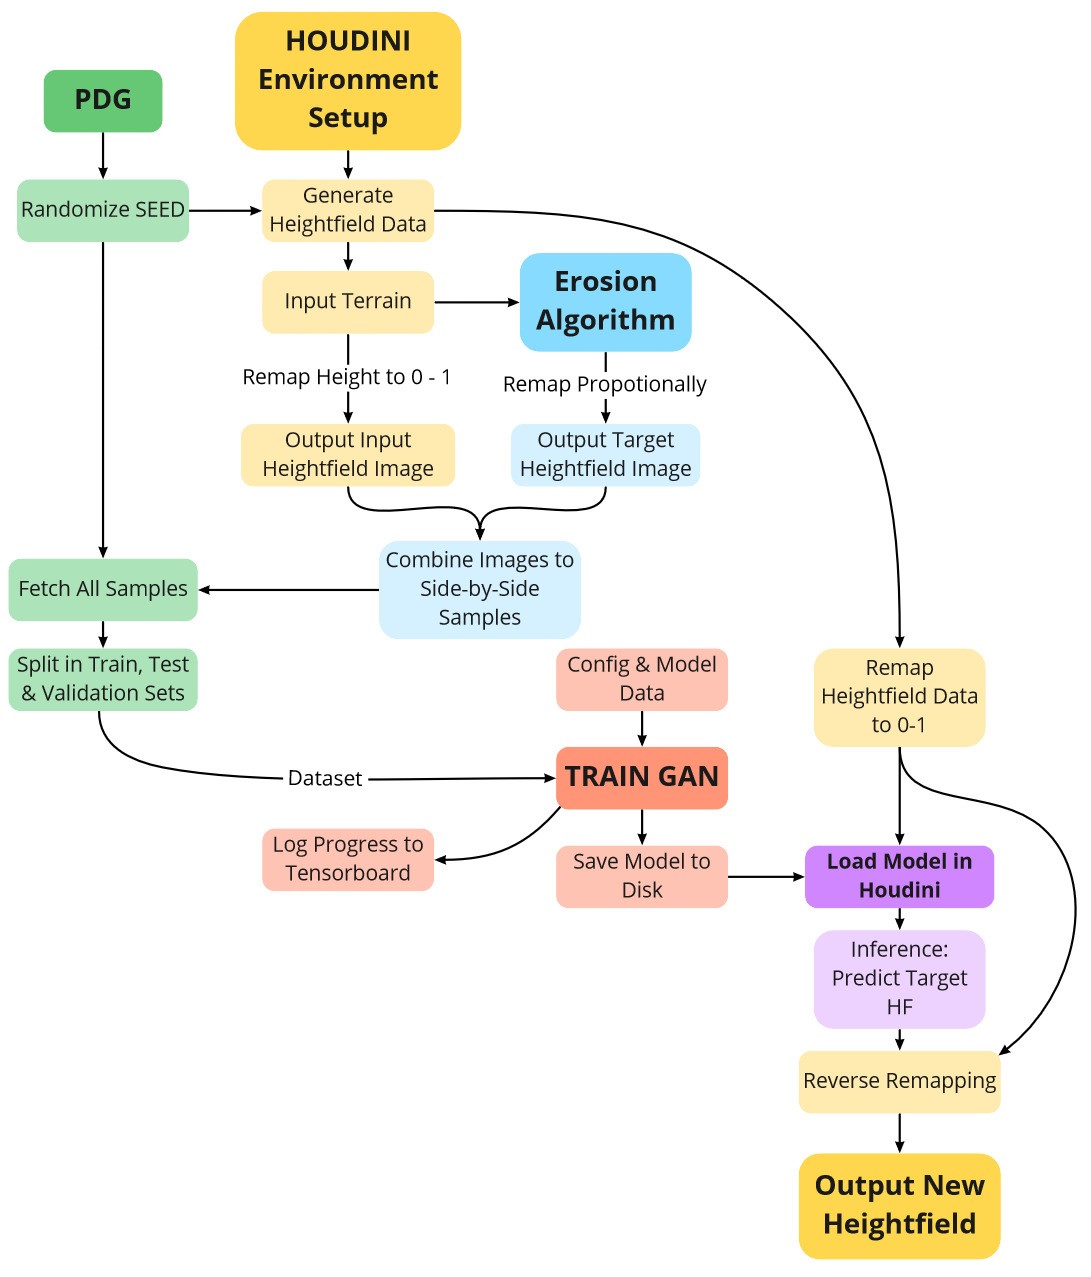
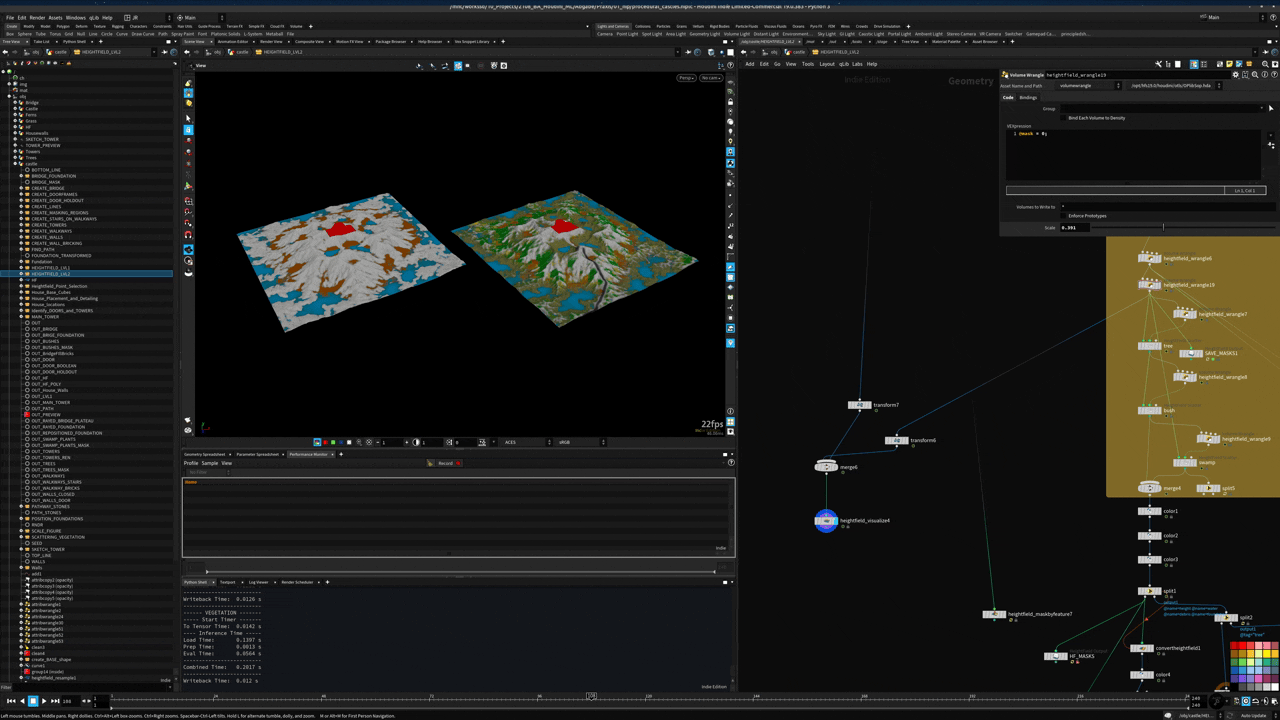
# Data Synthesis and PDG
As described above Houdini calculates the correct erosion / vegetation masks for a specific input. With the height data it provides water and sediment maps among others.
// Input and Eroded Heightfield
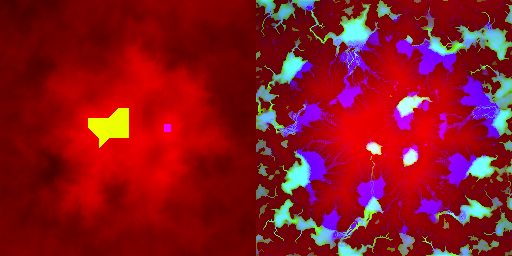
The two images below show 1 data sample consisting of input and output You can use the RGB channels to encode all sorts of data that could be useful. In this example it is set up as follows:
input R = Height input G = Castle Foundation input B = Castle Bridge Foundation
output R = Height output G = Water output B = Sediment
I chose to encode the castle and bridge foundations, because it was especially important, that there will be little to no height changes in this area and I hoped I could steer the model to focus on that. I can’t be sure whether it really worked because of the additional masks, but the results were pretty good.
// Erosion Data Sample (Input & Output)
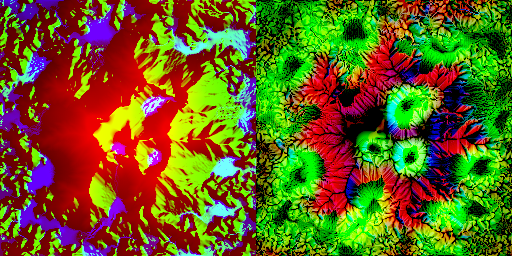
For the Vegetation I included different information:
input R = Height input G = South Direction ( Where the Sun hits most ) input B = Water
output R = Plant Type 1 output G = Plant Type 2 output B = Plant Type 3
// Vegetation Data Sample (Input & Output)
# Results
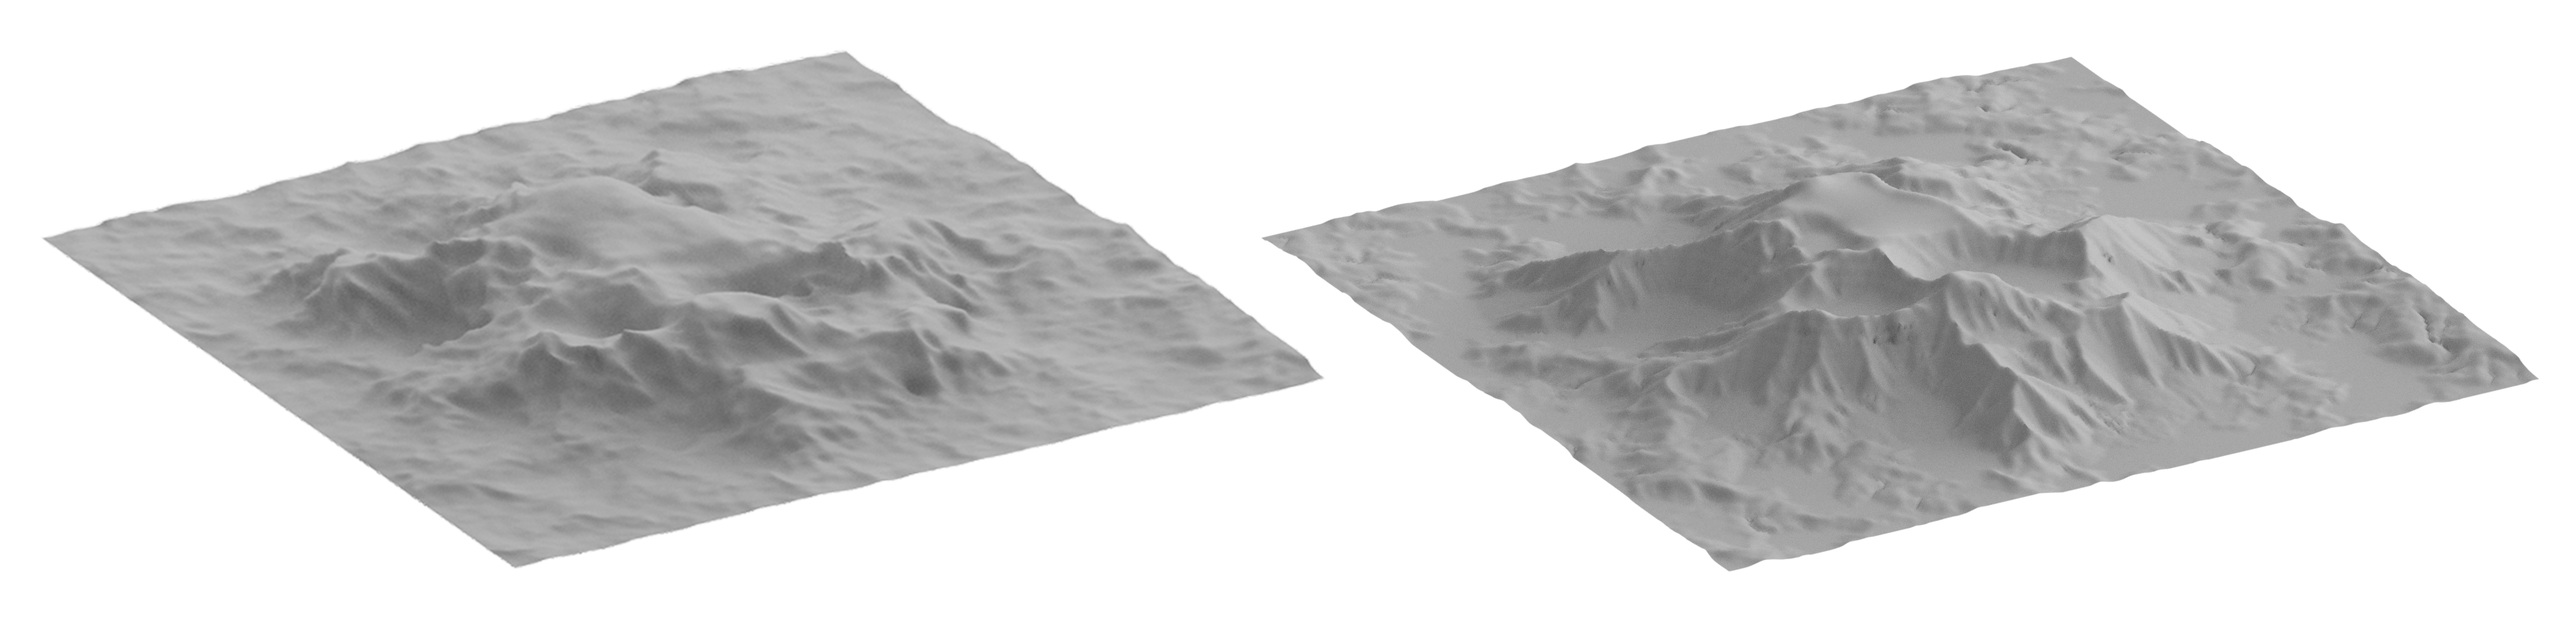
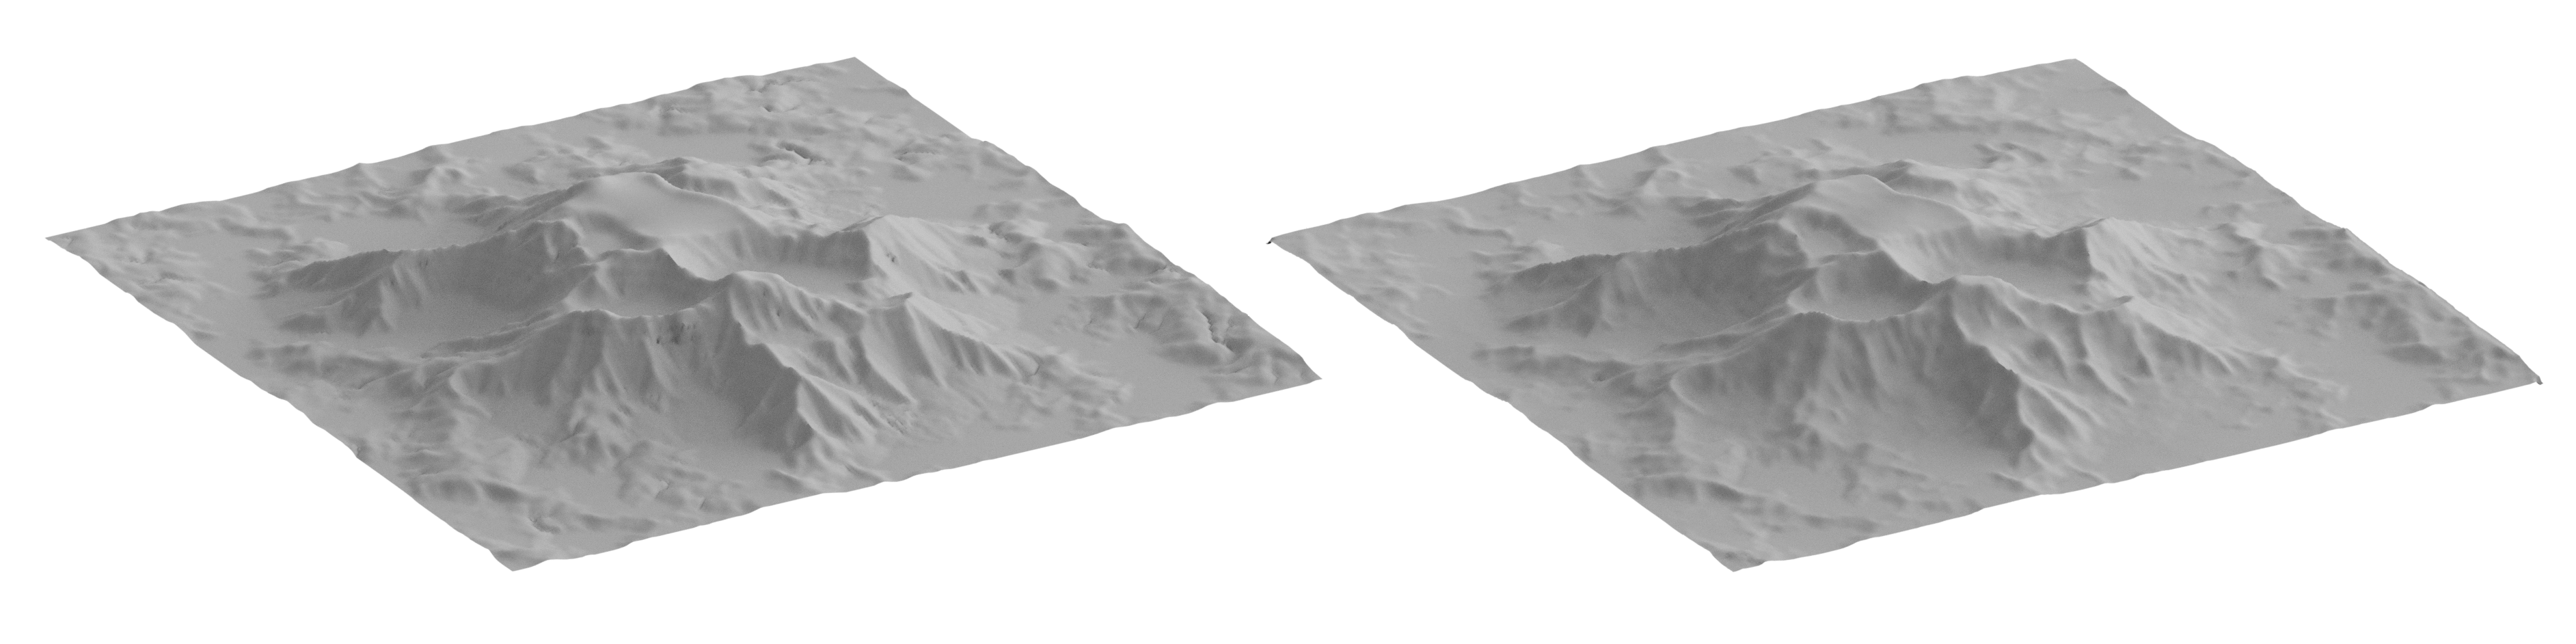
# Erosion
// Result (Ground Truth left / Prediction right)
// Error Visualization
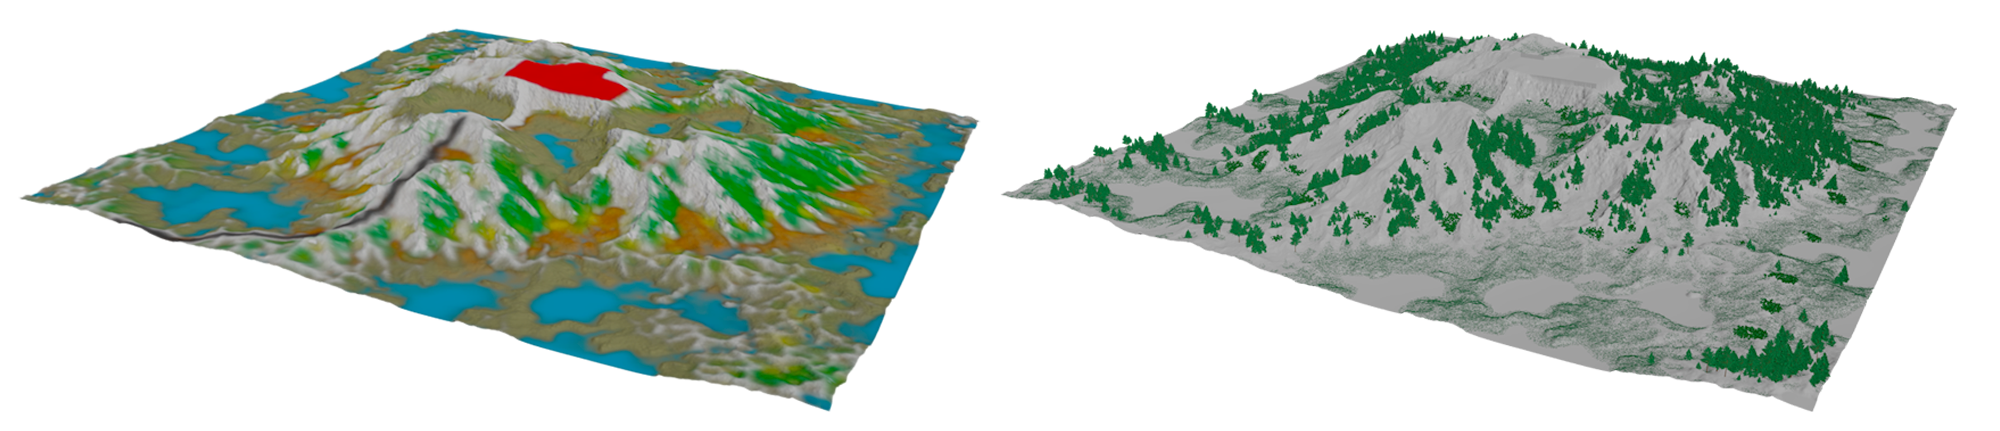
# Vegetation
// Predicted Masks (left) & Scattered Assets (right)
# Outlook
If provided with the right real world data set you could create a scatter system that matches the vegetation of certain regions in the world fairly easy. Also it might be possible to encode parameter values such as erosion strength etc. in the image to enhance user control.